A spreadsheet is not a table
Spreadsheets look unusually friendly to AI. Right?
Everything is neatly arranged into cells. Formulas handle the arithmetic. Compared with a 200-page PDF or a messy email thread, Excel should be easy.
But it isn’t. A real spreadsheet is closer to a small software system:
- The number you need might appear on one tab, or depend on a lookup table on a third.
- A color might encode a business rule: valid if green, invalid if red.
- A comment in Sheet2!D18 might change how a calculation should be interpreted.
The hard part is reconstructing the logic of the workbook.
Introducing GDP.xlsx
GDP.xlsx is a benchmark of 70 real-world tasks testing whether frontier models can work with professional Excel workbooks.
The tasks span 12 domains:
- finance
- healthcare
- engineering
- manufacturing
- insurance
- real estate
- legal
- HR
- agriculture
- energy
- logistics
- public sector
Models must inspect workbook contents with tools, navigate across sheets, examine formulas and formatting, perform calculations, and answer the kinds of questions a colleague might actually ask.
A good answer requires a model to figure out more than Excel syntax:
- where the truth lives: which sheet, record, or source is authoritative, and which summaries are stale;
- how the workbook fits together: how formulas, lookup tables, IDs, comments, and tabs connect;
- which rules apply: including dates, filters, approval states, exceptions, and business logic;
- what the structure means: including hidden rows, subtotals, merged headers, formatting, and other signals that change how values should be interpreted.
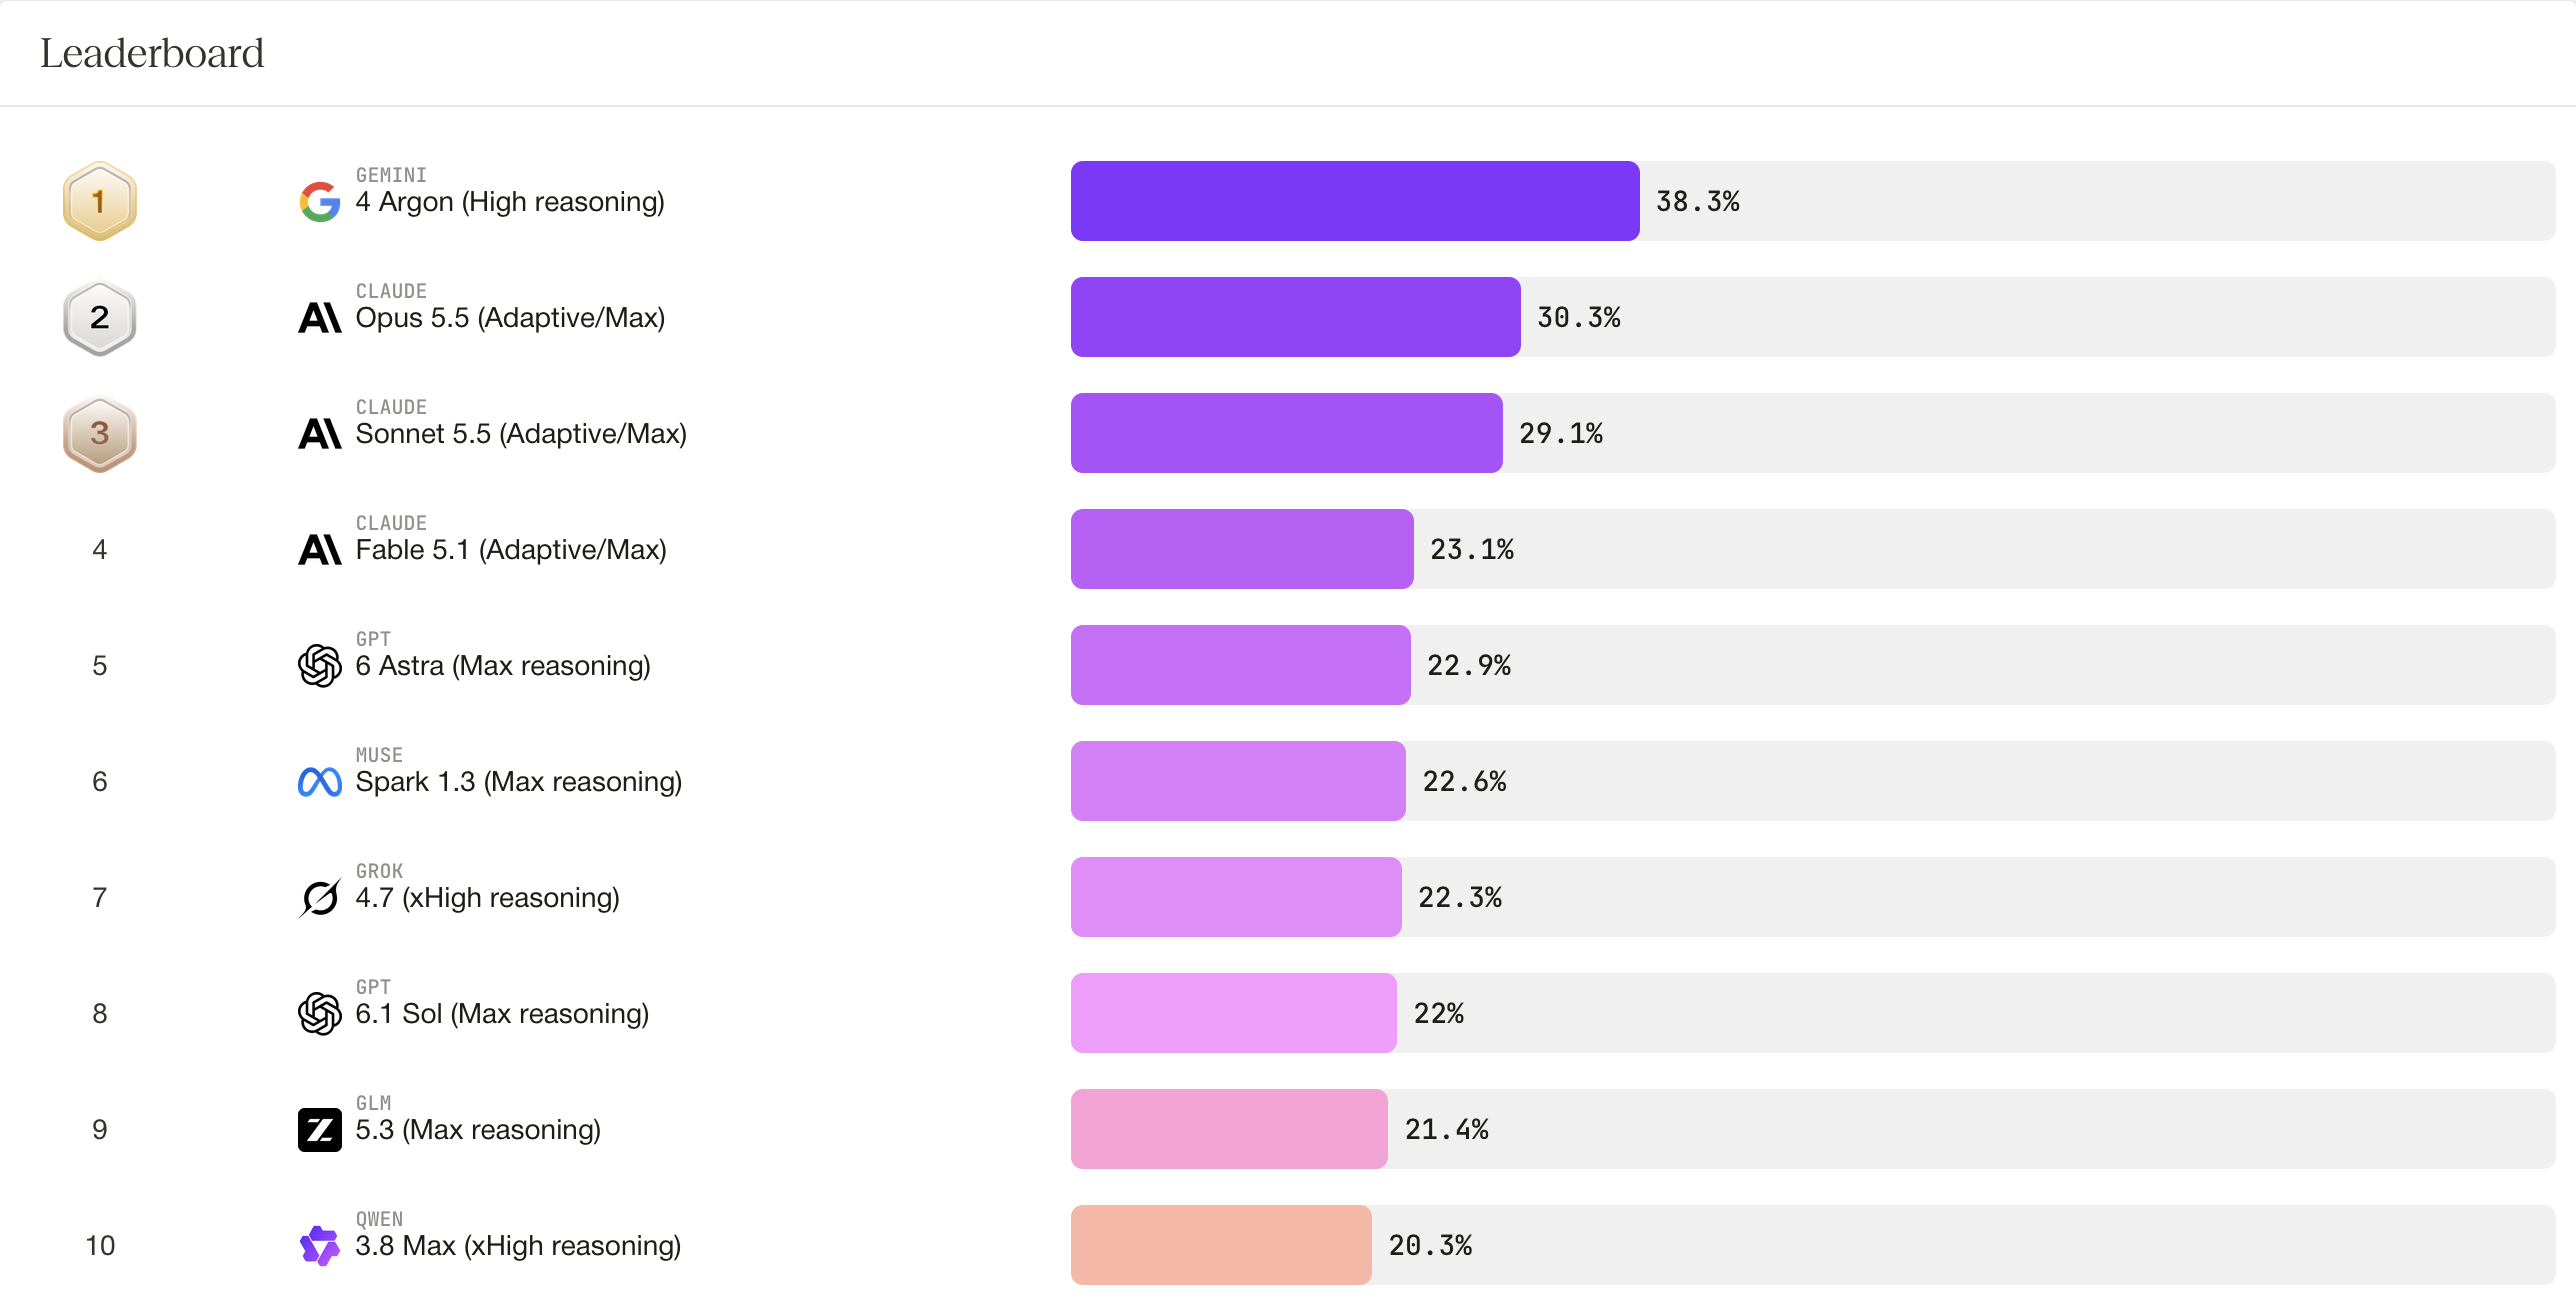
The best-performing model, Gemini 4 Argon, scores 38.3%.
Built from work professionals actually do
GDP.xlsx was created by professionals in the domains the benchmark covers.
We asked experts to start from real workflows where AI models had failed them: analyses they actually perform, decisions they actually make, and spreadsheets they actually rely on. They then turned those workflows into benchmark tasks.
Every task includes a spreadsheet. Tasks are graded against a set of must-have rubric criteria and go through a triple-review quality-control process before entering the benchmark, covering the source workbook, task instructions, expected reasoning, and grading criteria.
The result is meant to capture something simple: could you hand this workbook and this question to an AI agent and trust the answer?
The failures show why that remains difficult.
Failure: Astra never looked at a decisive tab
Consider one GDP.xlsx task involving a product-certification tracker.
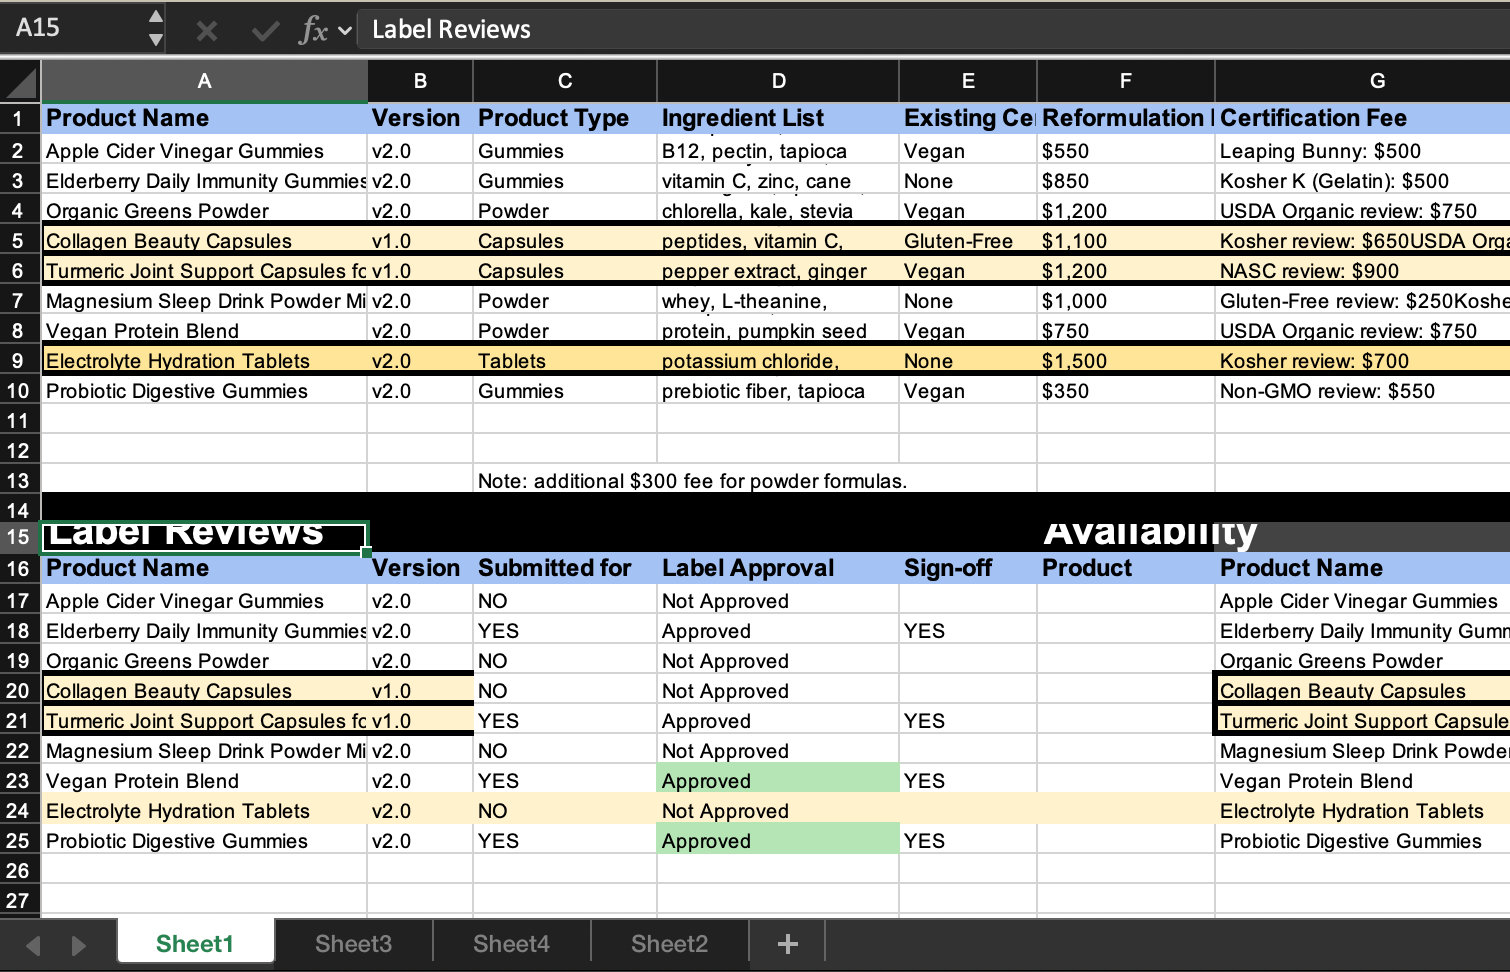
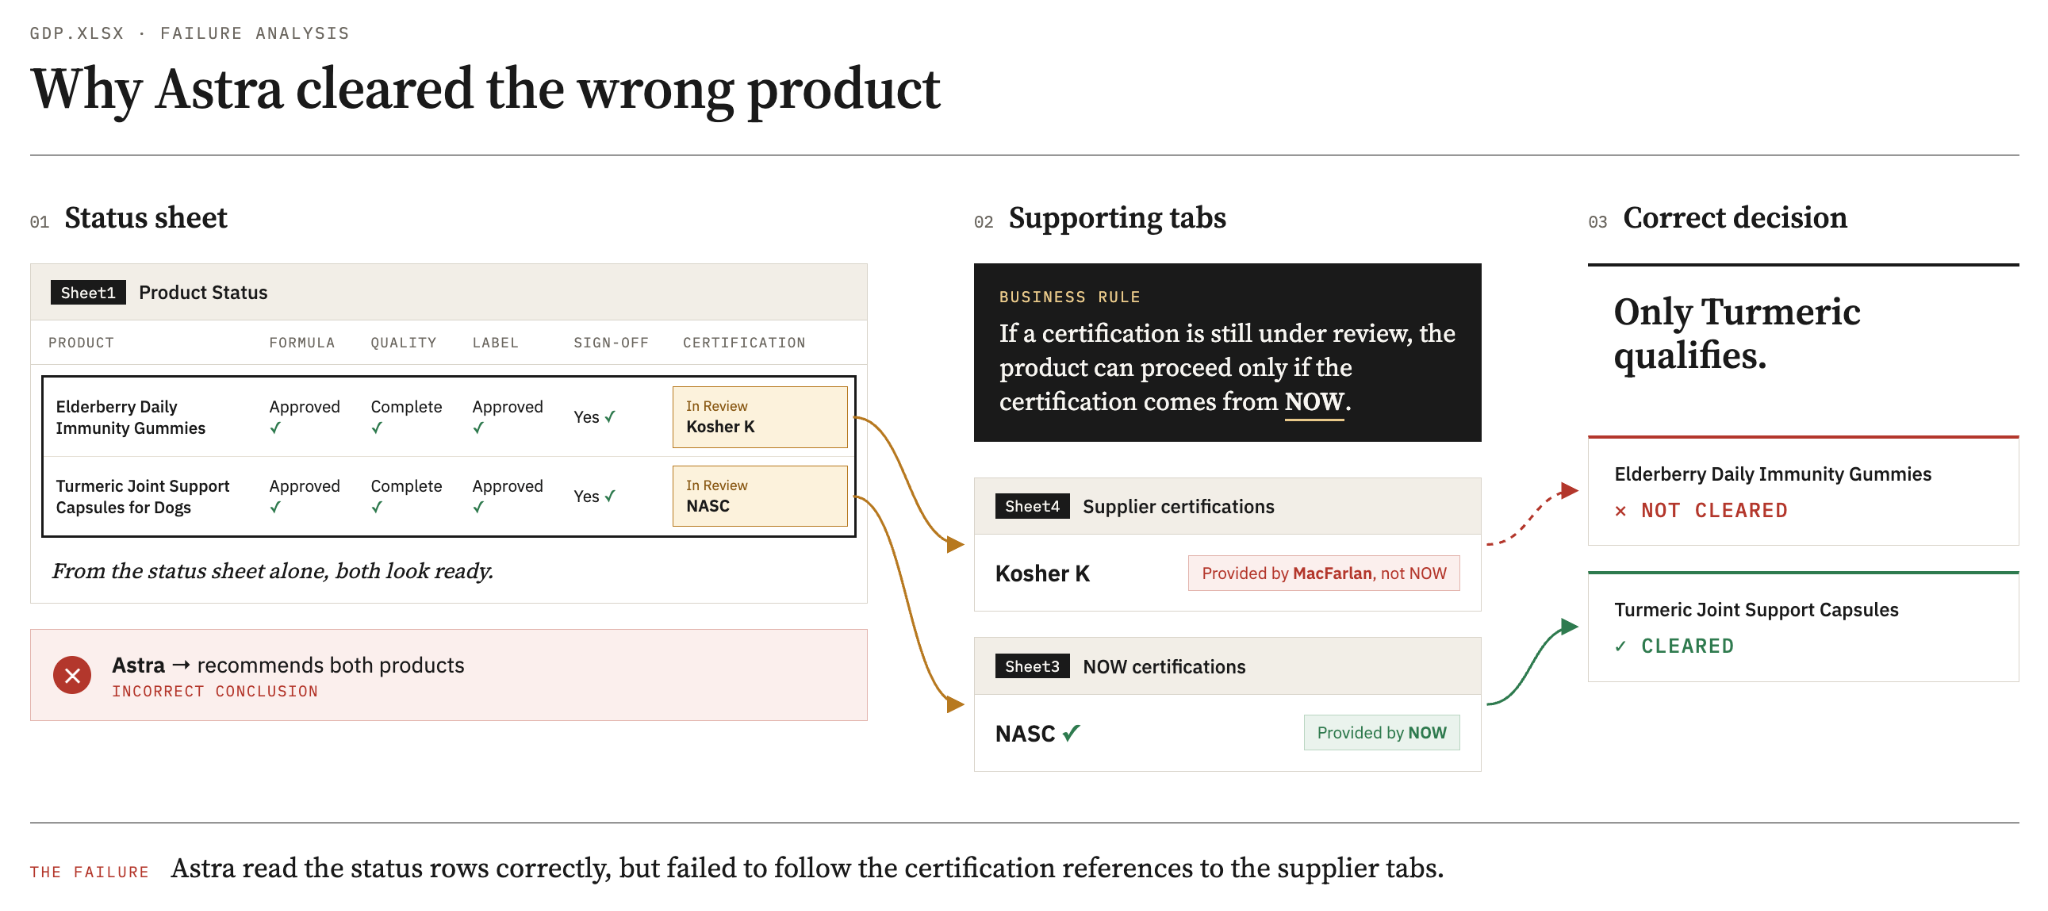
A quality manager needs to decide which products are cleared for production. On the main status sheet, two products look equally ready: their formulas, quality checks, and labels are approved, while one certification remains pending.
At first glance, both appear ready. However, there is another rule: if certification is still pending, the product can proceed only when the certification is handled by a particular manufacturer.
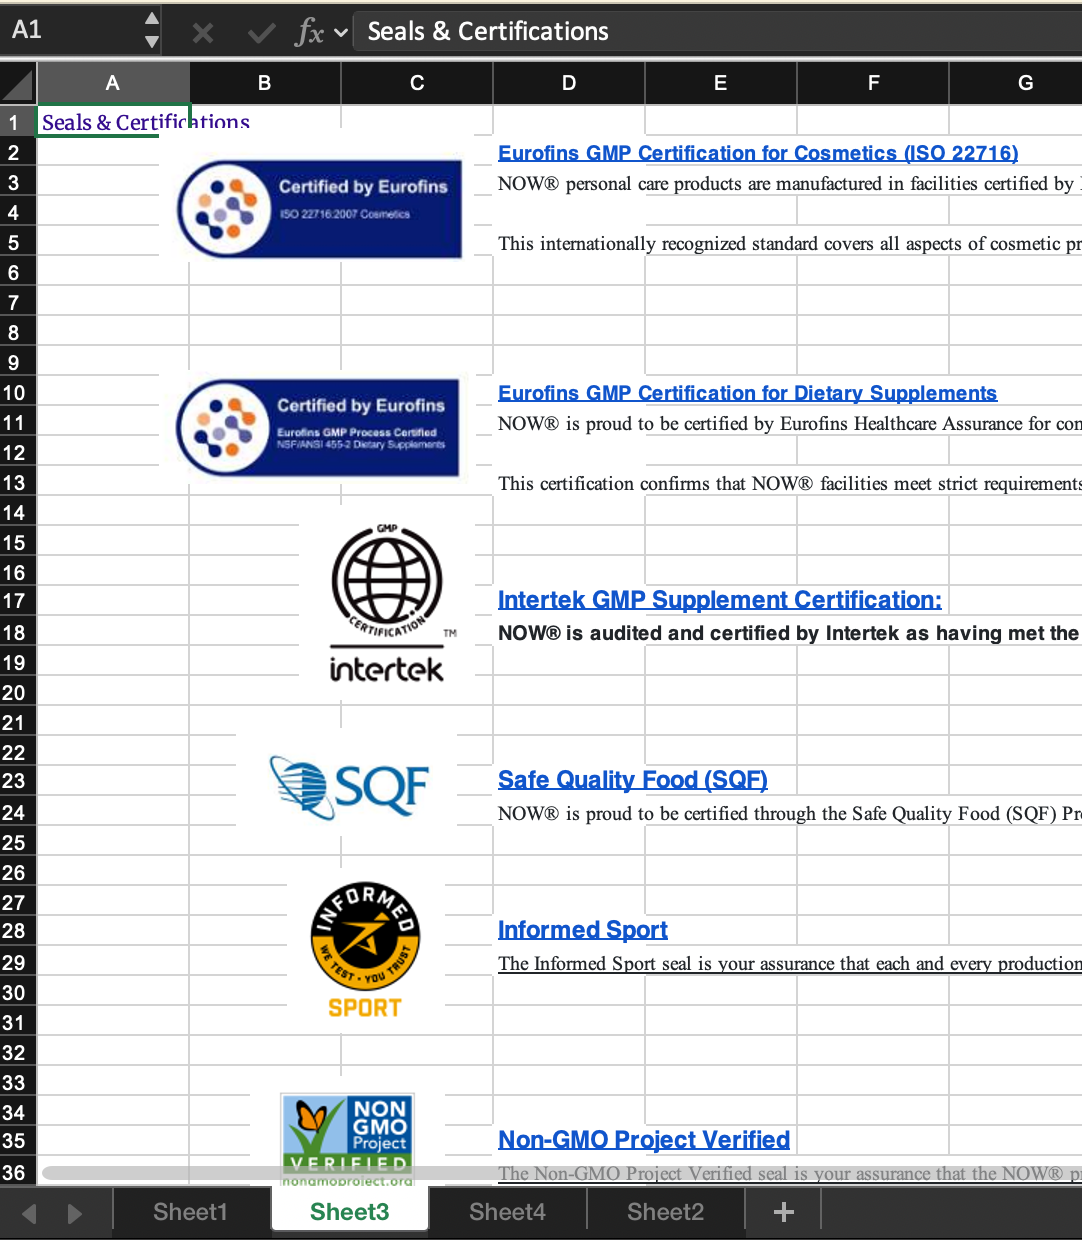
That information lives on another tab. There, the two products diverge:
- Product A’s pending certification is handled by the required manufacturer.
- Product B’s is not.
So only Product A qualifies.
Astra incorrectly recommended both products. It even said the workbook did not identify the relevant supplier, although the supplier was named in another tab.
Failure: Muse Spark 1.3 found the discounts and missed the break clauses
Another GDP.xlsx task uses a commercial real-estate fund’s rent-forecast workbook.
It contains fifteen tabs: monthly forecasts, tenancy records, rent reviews, occupancy information, break clauses, and even an asset manager’s email copied into the file. Around sixty cell comments document concessions and special cases.
The user asks for two analyses:
- Forecast rent on currently vacant US properties.
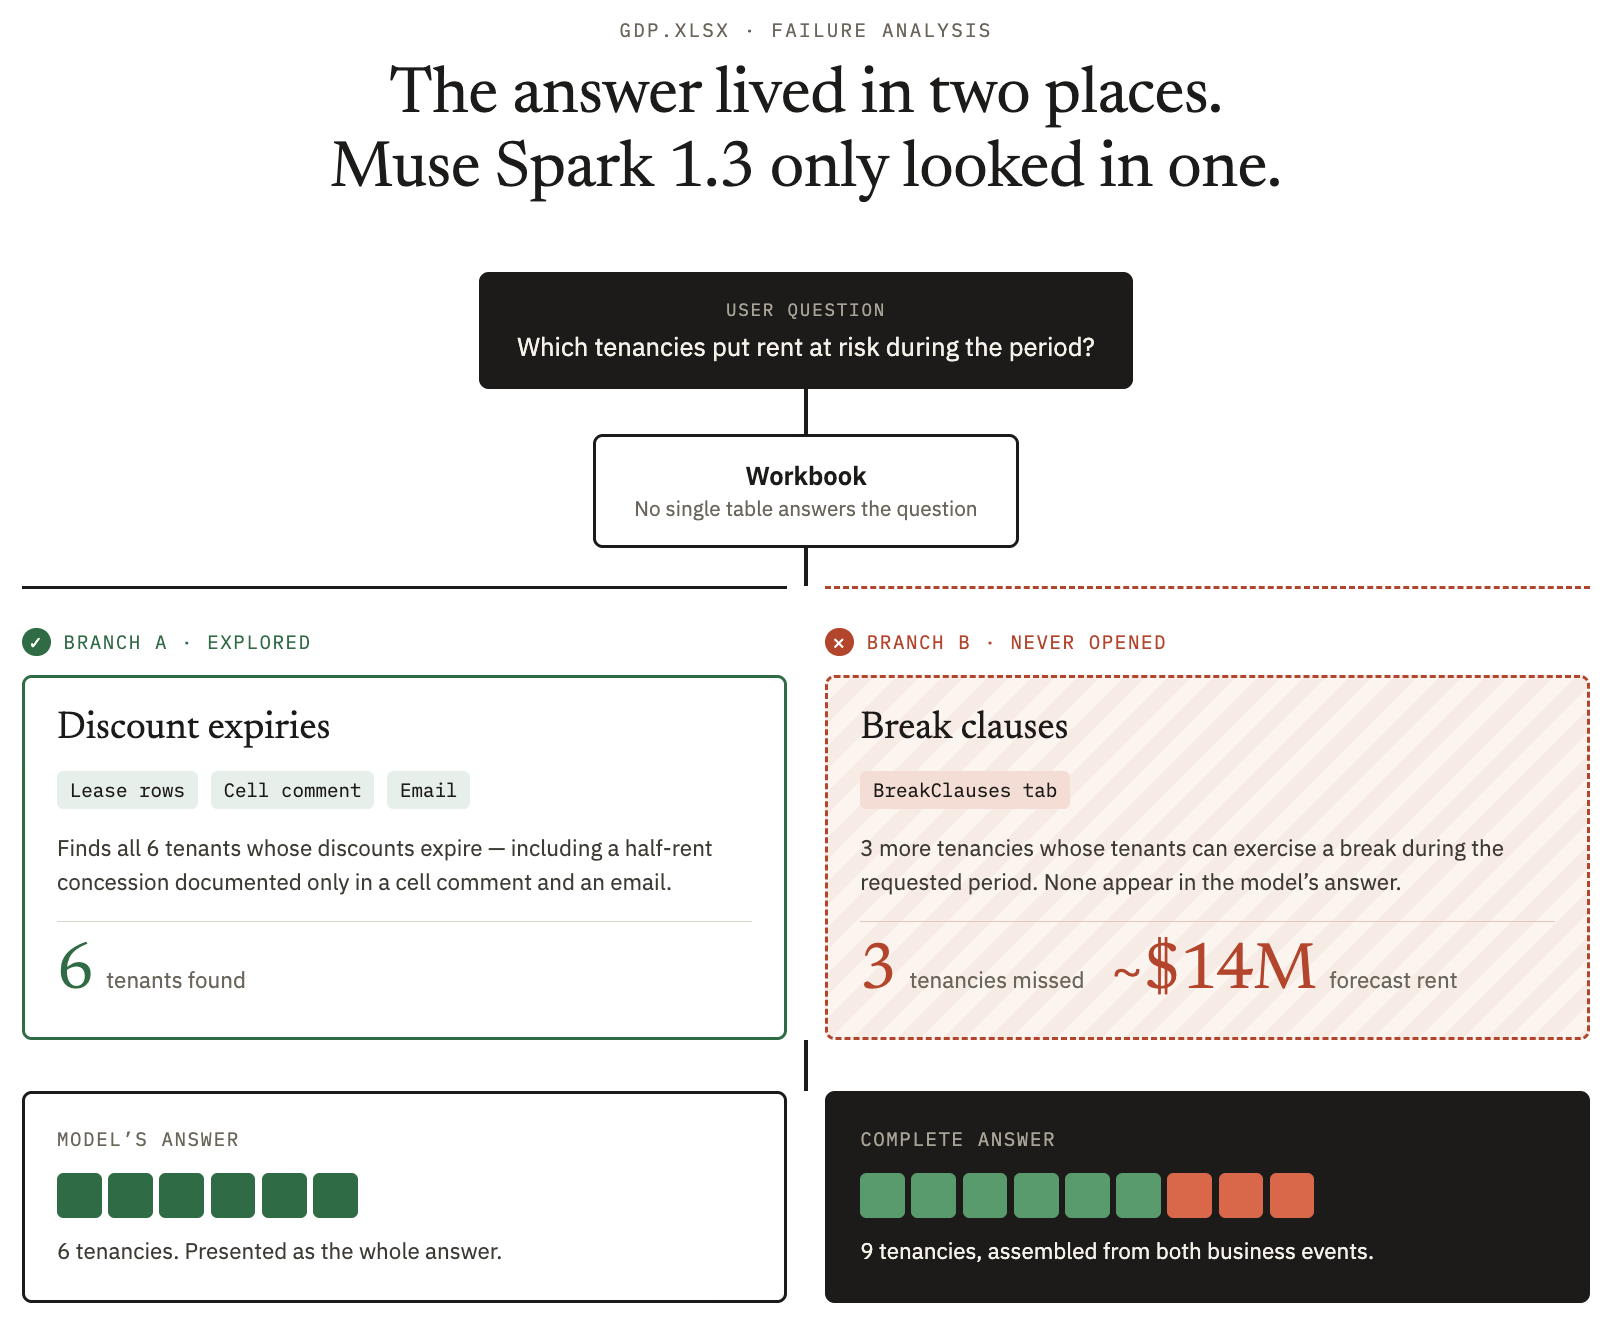
- Identify every tenancy whose rent could change during the next three years, either because a rent discount ends or because the tenant gains the right to break the lease early.
Muse Spark 1.3 handles the first part correctly.
It also finds all six tenants whose discounts expire during the period, including a half-rent concession documented only in a cell comment and an email.
Then it stops.
A separate BreakClauses tab contains three more tenancies whose tenants can exercise a break during the requested period. Together, those rows represent roughly $14 million in forecast rent. None appear in the answer.
The model successfully followed one path through the workbook and acted as though it had exhausted the problem. But the spreadsheet did not contain one neat table answering the user’s question. The answer had to be assembled from two different kinds of business events represented in two different places.
The logic is spread across the workbook
This is what makes spreadsheets a distinct AI challenge.
In a PDF, information is distributed across paragraphs, tables, charts, footnotes, and appendices.
In a spreadsheet, the logic itself is distributed.
- The data is on one sheet; the calculation is on another.
- Colors can encode business meaning.
- A lookup table defines what a code means.
- A hidden row changes a total.
- A comment contains an exception.
- An embedded diagram may contain information that exists nowhere in the cells.
People who work with these files every day build an implicit mental model of all of this.
- They know which tab is stale.
- They know what “ready” actually means.
- They know which number Finance trusts.
- They know that the red value is an exception, not just another number.
- The workbook rarely explains these rules in one place.
An AI agent taking over the job has to reconstruct that mental state. That is what GDP.xlsx measures.
The world runs on spreadsheets
GDP.pdf asks whether models can understand the documents professionals work from.
GDP.xlsx asks the next question: can they use a spreadsheet to make the right decision?
That’s what spreadsheets are for. They’re where a company decides what can ship, what an asset is worth, who gets paid, or whether production can proceed.
So the real test is whether you can hand an agent a workbook and ask:
What should we do?
If a human still has to explain which tabs matter, flag stale numbers, point out exceptions, and audit the answer afterward, the hard work is still theirs.
To learn more about GDP.xlsx or get access to the full benchmark, contact benchmarks@surgehq.ai.