New, state-of-the-art language models like DeepMind’s Gopher, Microsoft’s Megatron, and OpenAI’s GPT-3 are driving a wave of innovation in NLP. How do you measure the performance of these language models to see how good they are? In a previous post, we gave an overview of different language model evaluation metrics. This post dives more deeply into one of the most popular: a metric known as perplexity.
Disappointed in your MTurk results? Surge AI delivers better data, faster. Book a quick intro call with our team today!
A chore
Imagine you’re trying to build a chatbot that helps home cooks autocomplete their grocery shopping lists based on popular flavor combinations from social media. Your goal is to let users type in what they have in their fridge, like “chicken, carrots,” then list the five or six ingredients that go best with those flavors. You’ve already scraped thousands of recipe sites for ingredient lists, and now you just need to choose the best NLP model to predict which words appear together most often. Easy, right?
Well, not exactly. The gold standard for checking the performance of a model is extrinsic evaluation: measuring its final performance on a real-world task. In this case, that might mean letting your model generate a dataset of a thousand new recipes, then asking a few hundred data labelers to rate how tasty they sound.
Unfortunately, you don’t have one dataset, you have one dataset for every variation of every parameter of every model you want to test. Even simple comparisons of the same basic model can lead to a combinatorial explosion: 3 different optimization functions with 5 different learning rates and 4 different batch sizes equals 120 different datasets, all with hundreds of thousands of individual data points. How can you quickly narrow down which models are the most promising to fully evaluate?
Enter intrinsic evaluation: finding some property of a model that estimates the model’s quality independent of the specific tasks its used to perform. Specifically, enter perplexity, a metric that quantifies how uncertain a model is about the predictions it makes. Low perplexity only guarantees a model is confident, not accurate, but it often correlates well with the model’s final real-world performance, and it can be quickly calculated using just the probability distribution the model learns from the training dataset.
In this week’s post, we’ll look at how perplexity is calculated, what it means intuitively for a model’s performance, and the pitfalls of using perplexity for comparisons across different datasets and models.
Calculating perplexity
To understand how perplexity is calculated, let’s start with a very simple version of the recipe training dataset that only has four short ingredient lists:
- chicken, butter, pears
- chicken, butter, chili
- lemon, pears, shrimp
- chili, shrimp, lemon
In machine learning terms, these sentences are a language with a vocabulary size of 6 (because there are a total of 6 unique words). A language model is just a function trained on a specific language that predicts the probability of a certain word appearing given the words that appeared around it.
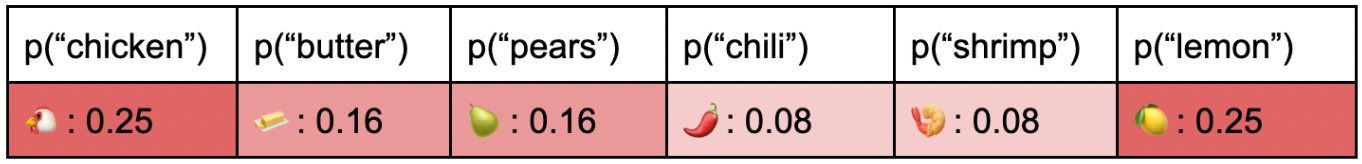
One of the simplest language models is a unigram model, which looks at words one at a time assuming they’re statistically independent. In other words, it returns the relative frequency that each word appears in the training data. Here’s a unigram model for the dataset above, which is especially simple because every word appears the same number of times:
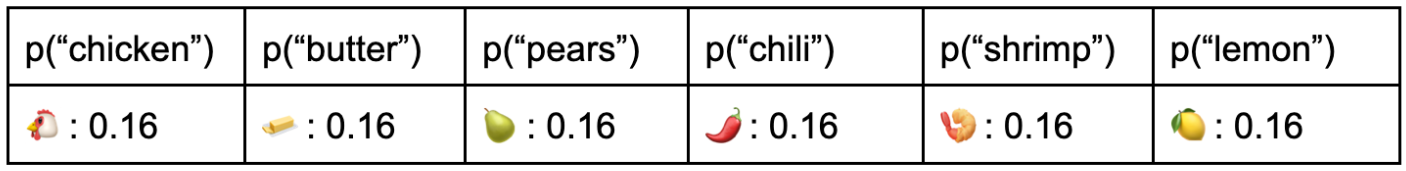
It’s pretty obvious this isn’t a very good model. No matter which ingredients you say you have, it will just pick any new ingredient at random with equal probability, so you might as well be rolling a fair die to choose. Let’s quantify exactly how bad this is.
We’re going to start by calculating how surprised our model is when it sees a single specific word like “chicken.” Intuitively, the more probable an event is, the less surprising it is. If you’re certain something is impossible - if its probability is 0 - then you would be infinitely surprised if it happened. Similarly, if something was guaranteed to happen with probability 1, your surprise when it happened would be 0.
Conveniently, there’s already a simple function that maps 0 → ∞ and 1 → 0: log(1/x). If we know the probability of a given event, we can express our surprise when it happens as:
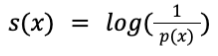
As you may remember from algebra class, we can rewrite this as:
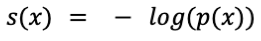
In information theory, this term - the negative log of the probability of an event occurring - is called the surprisal.
Our unigram model says that the probability of the word “chicken” appearing in a new sentence from this language is 0.16, so the surprisal of that event outcome is -log(0.16) = 2.64.
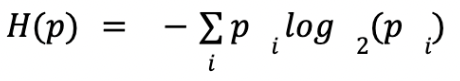
If surprisal lets us quantify how unlikely a single outcome of a possible event is, entropy does the same thing for the event as a whole. It’s the expected value of the surprisal across every possible outcome - the sum of the surprisal of every outcome multiplied by the probability it happens:
In our dataset, all six possible event outcomes have the same probability (⅙) and surprisal (2.64), so the entropy is just: ⅙ * 2.64 + ⅙ * 2.64 + ⅙ * 2.64 + ⅙ * 2.64 + ⅙ * 2.64 + ⅙ * 2.64 = 6 * (⅙ * 2.64) = 2.64.
Once we’ve gotten this far, calculating the perplexity is easy - it’s just the exponential of the entropy:
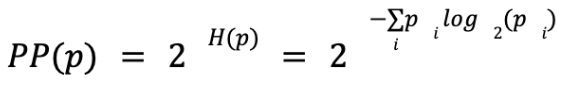
The entropy for the dataset above is 2.64, so the perplexity is 2^2.64 = 6.
You may notice something odd about this answer: it’s the vocabulary size of our language! To put it another way, it’s the number of possible words you could choose at each position in a sentence in this language, also known as the branching factor.
This may not surprise you if you’re already familiar with the intuitive definition for entropy: the number of bits needed to most efficiently represent which event from a probability distribution actually happened. If the entropy N is the number of bits you have, 2ⁿ is the number of choices those bits can represent. This means we can say our model’s perplexity of 6 means it’s “as confused” as if it had to randomly choose between six different words - which is exactly what’s happening.
Now imagine that we keep using the same dumb unigram model, but our dataset isn’t quite as uniform:
- chicken, butter, pears
- chicken, butter, lemon
- chicken, lemon, pears
- chili, shrimp, lemon
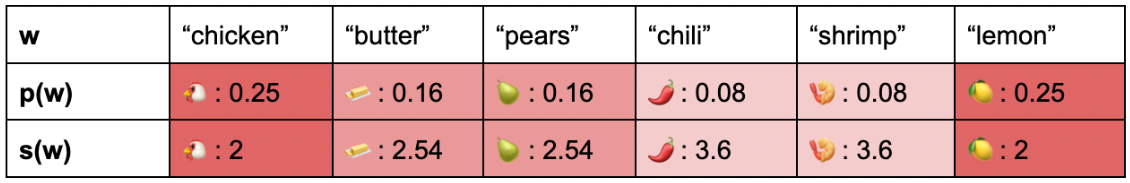
Here’s the probability distribution our model returns after training on this dataset (the brighter a cell’s color, the more probable the event):
Intuitively, this means it just got easier to predict what any given word in a sentence will be - now we know it’s more likely to be “chicken” than “chili.” Let’s see how that affects each word’s surprisal:
The new value for our model’s entropy is:

And so the new perplexity is 2^2.38 = 5.2. Now our new and better model is only as confused as if it was randomly choosing between 5.2 words, even though the language’s vocabulary size didn’t change!
As one outcome becomes disproportionately more likely, the model becomes less uncertain, so perplexity decreases, telling us this model is likely to be higher-quality than our first attempt.
Interpreting perplexity
The word likely is important, because unlike a simple metric like prediction accuracy, lower perplexity isn’t guaranteed to translate into better model performance, for at least two reasons.
First, as we saw in the calculation section, a model’s worst-case perplexity is fixed by the language’s vocabulary size. This means you can greatly lower your model’s perplexity just by, for example, switching from a word-level model (which might easily have a vocabulary size of 50,000+ words) to a character-level model (with a vocabulary size of around 26), regardless of whether the character-level model is really more accurate. Other variables like size of your training dataset or your model’s context length can also have a disproportionate effect on a model’s perplexity.
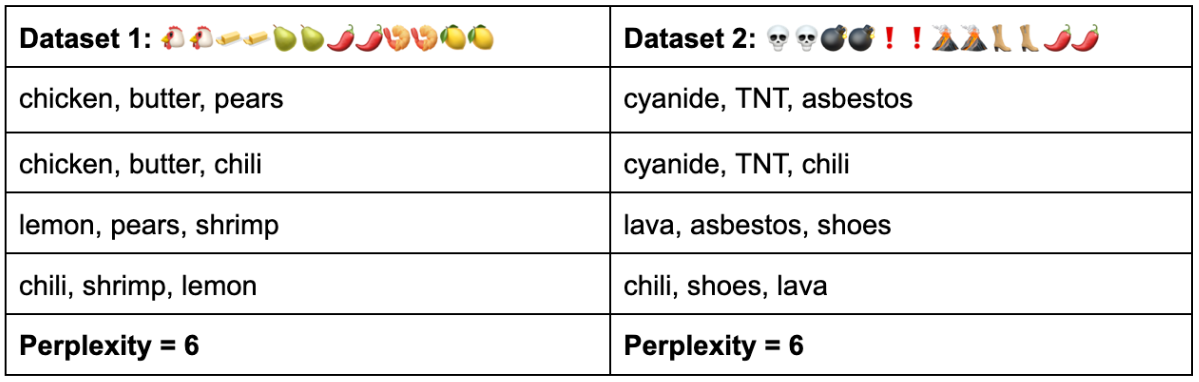
Second and more importantly, perplexity, like all internal evaluation, doesn’t provide any form of sanity-checking. To give an obvious example, models trained on the two datasets below would have identical perplexities, but you’d get wildly different answers if you asked real humans to evaluate the tastiness of their recommended recipes!
Perplexity in the real world
You can see similar, if more subtle, problems when you use perplexity to evaluate models trained on real world datasets like the One Billion Word Benchmark. This corpus was put together from thousands of online news articles published in 2011, all broken down into their component sentences. It’s designed as a standardardized test dataset that allows researchers to directly compare different models trained on different data, and perplexity is a popular benchmark choice.
Unfortunately, as work by Helen Ngo, et al. shows, a model’s perplexity can be easily influenced by factors that have nothing to do with model quality. When her team trained identical models on three different news datasets from 2013, 2016, and 2020, the more modern models had substantially higher perplexities:
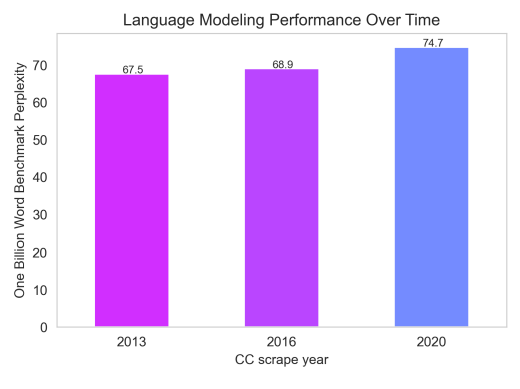
The problem is that news publications cycle through viral buzzwords quickly - just think about how often the Harlem Shake was mentioned 2013 compared to now. Since perplexity effectively measures how accurately a model can mimic the style of the dataset it’s being tested against, models trained on news from the same period as the benchmark dataset have an unfair advantage thanks to vocabulary similarity.
Even worse, since the One Billion Word Benchmark breaks full articles into individual sentences, curators have a hard time detecting instances of decontextualized hate speech. (For example, “The little monkeys were playing” is perfectly inoffensive in an article set at the zoo, and utterly horrifying in an article set at a racially diverse elementary school.) Since perplexity rewards models for mimicking the test dataset, it can end up favoring the models most likely to imitate subtly toxic content.
Perplexity in a nutshell
Pros:
- Fast to calculate, allowing researchers to weed out models that are unlikely to perform well in expensive/time-consuming real-world testing
- Useful to have estimate of the model’s uncertainty/information density
Cons:
- Not good for final evaluation, since it just measures the model’s confidence, not its accuracy
- Hard to make apples-to-apples comparisons across datasets with different context lengths, vocabulary sizes, word- vs. character-based models, etc.
- Can end up rewarding models that mimic toxic or outdated datasets
Finally, it’s worth noting that perplexity is only one choice for evaluating language models. There are many alternatives, some closely related to perplexity (cross-entropy and bits-per-character), and others that are completely distinct (accuracy/precision/F1 score, mean reciprocal rank, mean average precision, etc.).
Surge AI is a data labeling workforce and platform that provides world-class data to top AI companies and researchers. We're built from the ground up to tackle the extraordinary challenges of natural language understanding — with an elite data labeling workforce, stunning quality, rich labeling tools, and modern APIs. Want to improve your model with context-sensitive data and domain-expert labelers? Sign up for free or schedule a demo with our team today!
The average number of ads on a Google Search recipe? 8.7

Data Labeling 2.0 for Rich, Creative AI
Superintelligent AI, meet your human teachers. Our data labeling platform is designed from the ground up to train the next generation of AI — whether it’s systems that can code in Python, summarize poetry, or detect the subtleties of toxic speech. Use our powerful data labeling workforce and tools to build the rich, human-powered datasets you need today.